Today in math we did statistics on a google sheet. It was quite easy part from when I kept forgetting to do the axis titles. I made a pie graph and a collom graph. We got all this data from yesterdays survey I went around asking people what is there favorite takeaway they then put there hand up for whatever one they wanted.
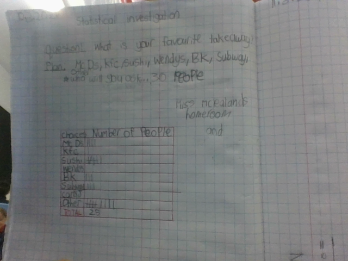
That is the tally

That is the bar graph with all the data
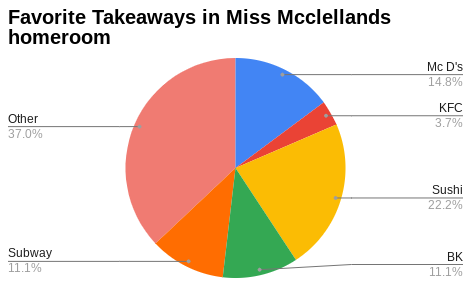

And those are the finish pie chart and bar chart!!
Bye